We use cookies
This site uses cookies from cmlabs to deliver and enhance the quality of its services and to analyze traffic..
We use cookies
This site uses cookies from cmlabs to deliver and enhance the quality of its services and to analyze traffic..
Last updated: Jun 13, 2022
Disclaimer: Our team is constantly compiling and adding new terms that are known throughout the SEO community and Google terminology. You may be sent through SEO Terms in cmlabs.co from third parties or links. Such external links are not investigated, or checked for accuracy and reliability by us. We do not assume responsibility for the accuracy or reliability of any information offered by third-party websites.

This guide covers everything you need to know about the Google Search console. This tool is quite familiar among webmasters because it helps them monitor their website performance in just one tool.
If you want to know more about the definitions, features, and how to use google search console (GSC), then this guide is the answer.
Google Search Console (GSC) is a free tool from Google that helps web owners to monitor performance, traffic, and fix problems on their websites. This tool comes with a number of data such as the number of impressions, total clicks, average CTR, average position, website performance on mobile devices, and more.
GSC, previously known as Google Webmaster Tools, continues to develop its features. The feature has many benefits for web owners or bloggers who need SEO tools to monitor and optimize their website performance.
As previously mentioned, the GSC is equipped with quite complete features. Google Search Console features offer the Overview, Performance, URL Inspection, Index, Page Experience, and Security. Find the explanation of each of the Google Search Console features below:
The overview feature in GSC contains four main reports consisting of
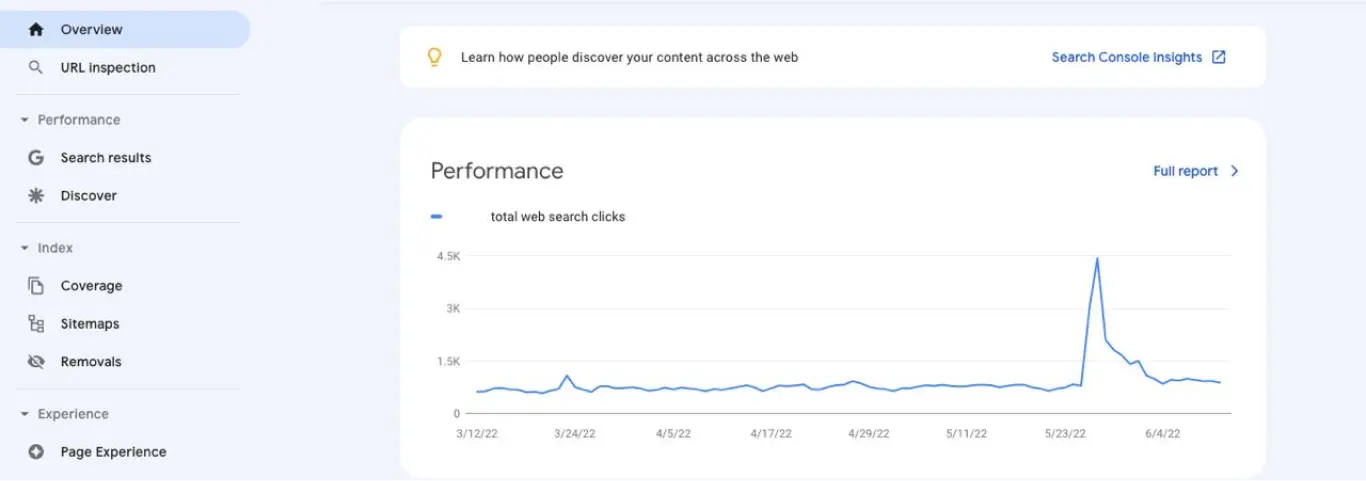
The performance tool shows the amount of traffic you managed to get from Google search results. This feature allows you to view traffic by query, page, country, device type, and more.
When you open the performance report, you'll see the following four SEO metrics:

The URL inspection tool provides information about specific pages on your website that Google has indexed successfully. The information includes AMP issues, structured data issues, and other indexing issues.
The functions of the URL inspection feature found in Google Search Console are as follow:
The index feature in GSC consists of three main reports including index coverage, sitemaps, and a list of removed URLs. Check out the explanation of the reports function:
Index Coverage (Coverage)
The indexing coverage report shows which pages of your site Google succeeded and failed to index. In addition, this feature also comes with information regarding indexing issues found on your site.
There are 4 assessment statuses that will be displayed on the coverage index report, namely:
Each index rating status will have a specific reason that caused the indexing problem to occur as well as recommendations on how to fix it. In addition, Google also allows GSC users to share and export this index coverage report data.

Sitemaps
The sitemap feature in Google Search Console helps you to view the sitemaps that Google has found, add new sitemaps to your site, view the history of sitemap additions, and identify errors in your site's sitemap.
Reports displayed for each sitemap added in GSC include:
URL Removal (Removals)
GSC allows you to temporarily block a page's URL from Google search results, view a history of user-submitted URL removal requests, and view URLs on your website that are reported as adult content with Google's Safe Search filters.
This feature can only remove URLs in Google search results and cannot be applied to other search engines. You can take advantage of this tool to troubleshoot crawl issues in your GSC account, get rid of hacked URLs, fix duplicate content issues, and more.
Page experience is one of the ranking factors in Google's SERP. Therefore, you should carry out regular monitoring and improve the quality of the user experience on the web pages that you have. That way, users will have a pleasant experience on your site and your site's ranking will increase.
The page experience feature in Google Search Console groups three reports consisting of page experience, core web vitals, and mobile usability. Take a look at the presentations of the three reports below:
Page Experience
The page experience report shows a summary of the user experiences who visited your website. Google performs an assessment of page experience metrics on each URL on your site as one of Google ranking factors.
The data displayed includes the percentage of good URLs, total good URL impressions, and the daily value of good URLs percentage.

Core Web Vitals
The core web vitals report deals with the assessment of a website's performance on both desktop and mobile rankings. With this report, you can track the performance of URLs categorized by status (good, need of improvement, or poor), metric types (FID, LCP, and CLS), and URL groups (groups of similar pages). Only indexed URLs are shown in this report.
The three main metrics in core web vitals are First Input Delay (FID), Largest Contentful Paint (LCP), and Cumulative Layout Shift (CLS). The performance of a website can be said to be good if the site manages to reach the minimum score on these three metrics.
Mobile Usability
The mobile usability report provides information regarding issues your website is experiencing accessed on a mobile device. If it is found that your site does not support page responsiveness on mobile devices, then you should fix it immediately to improve the user experience.
The manual actions and security features provide information regarding violations that occurred on your website so that the page gets a warning from Google. A website will get a penalty from Google if it loads a page that doesn't comply with Google's guidelines.
Besides understanding the basic concepts of GSC, you also need to do hands-on practice so you can monitor the performance and optimize your website. In the following passage, we will show you how to use Google Search Console.
The first thing is that you have to add the site to the GSC. To complete the action, you need to log in using email to the GSC page. After successfully logging in, click the “Add property” option, then you will be required to enter the domain address in the field provided.
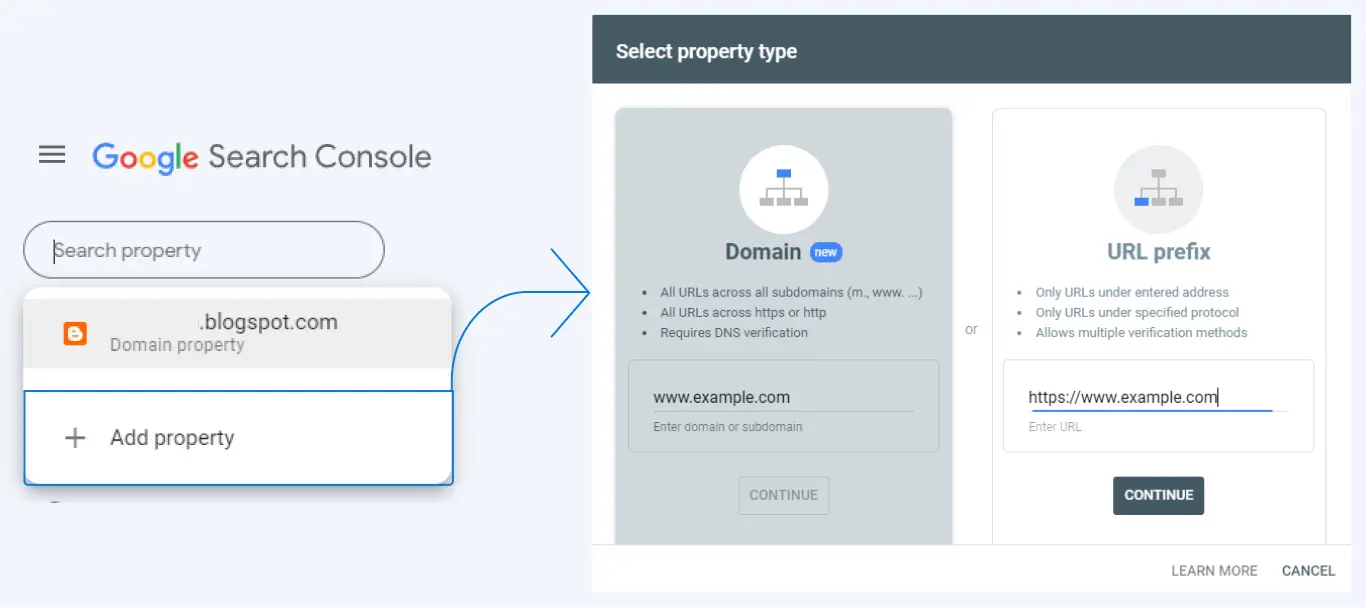
Next, you need to verify the domain. Here are 4 ways to verify your site on Google Search Console:
You can set which countries you target to instruct so that your site appears on search results in the country you choose. To set the target country, you need to select the Legacy tools and reports menu, then click the International Targeting sub-menu and open the Country tab.
Next, determine which country is your target market. Setting a target country aims to help Google better understand your primary target audience. However, your site may appear in search results of other countries if it is relevant to the user's search query.

To connect GSC and Google Analytics is by press the Admin menu on the Google Analytics dashboard, then selecting Property Settings, and then press the "Adjust Search Console" button.
Google Analytics will direct you to the Google Search Console page along with the entire list of websites you have monitored. Select a website that you want to connect with Google Analytics, then press the “Save” button and Google Analytics will be linked to your GSC account.
The greater the size of the website, the more pages and content it has. Great websites usually have more than 100 web pages. If your site is included in a great website, you need to add a sitemap to Google to facilitate the crawling and indexing process.
If you don't have a sitemap yet, then you can use the Sitemap Generator tool from cmlabs. Here is how to add a sitemap in Google Search Console:
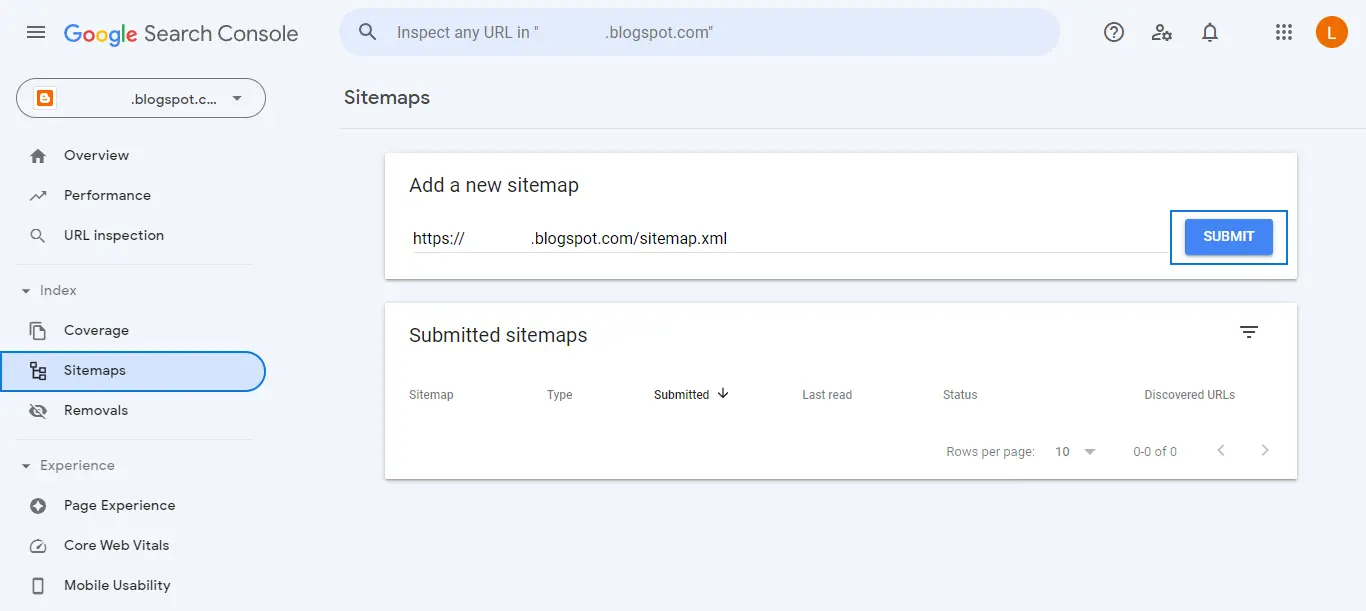
Select the Index menu in GSC, then you will see several sub-menus such as Coverage, Sitemaps, and Removals. To add a sitemap, click the Sitemaps sub-menu.
Next, copy your sitemap URL and click the “Submit” button to add the sitemap to Google. GSC will display a message on whether or not the addition of the sitemap was successful.
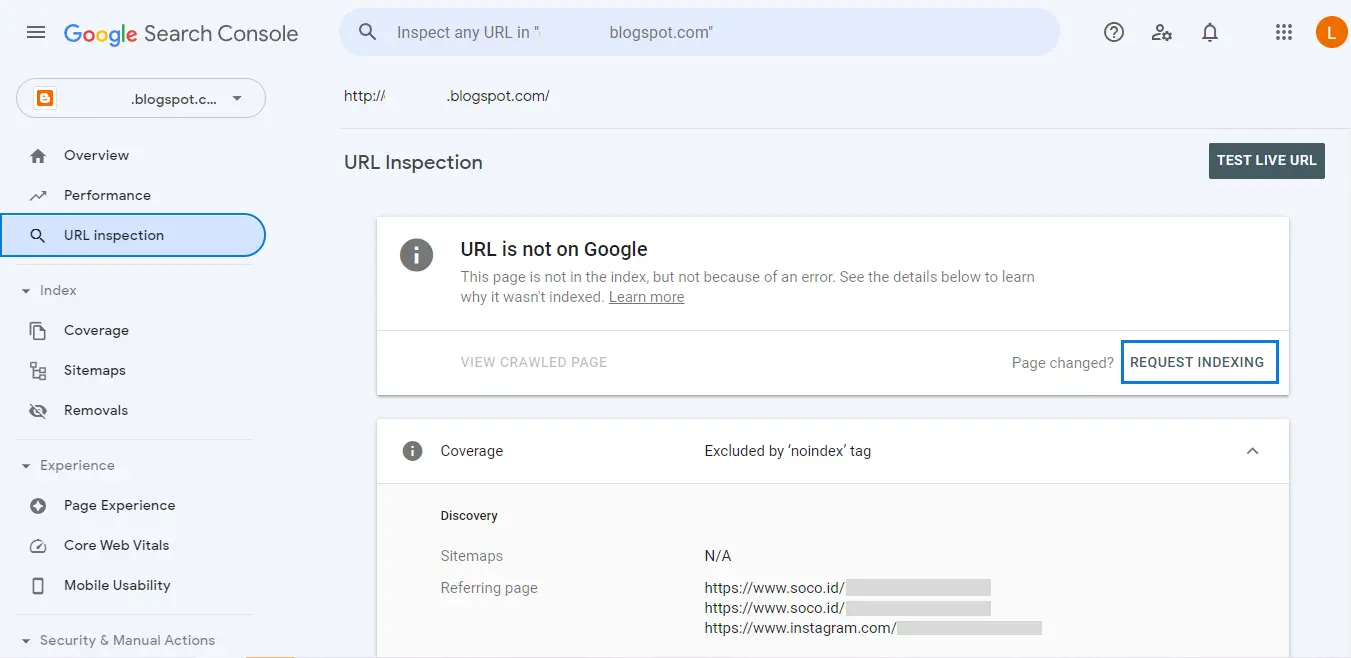
With Google Search Console, you can also request indexing. Click the URL inspection menu then enter the URL address of the web page you want to index. After that, GSC will display detailed information on whether the URL you entered has been indexed or not.
If the URL you entered is not indexed, you can submit a re-indexing request by pressing the “Request Indexing” option.
GSC also supports team collaboration. You can add multiple users to one website monitoring project. Here's how to use Google Search Console to add multiple users:
Open GSC and select the Settings menu then GSC will direct you to the general settings page.

On that page, select the Users and Permissions option, then click the “Add User” option. GSC will ask you to complete the user data to be added, including email and the type of permission granted.
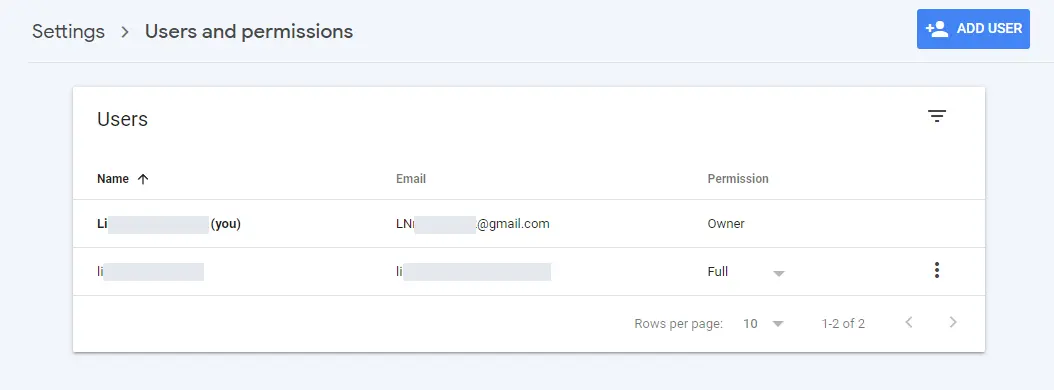
Enter the user’s email address and set the Permission type for that user. The permission options that can be given are Owner (property owner), Full (full access rights for all GSC features), and Restricted (access rights to view data, but cannot add other users).
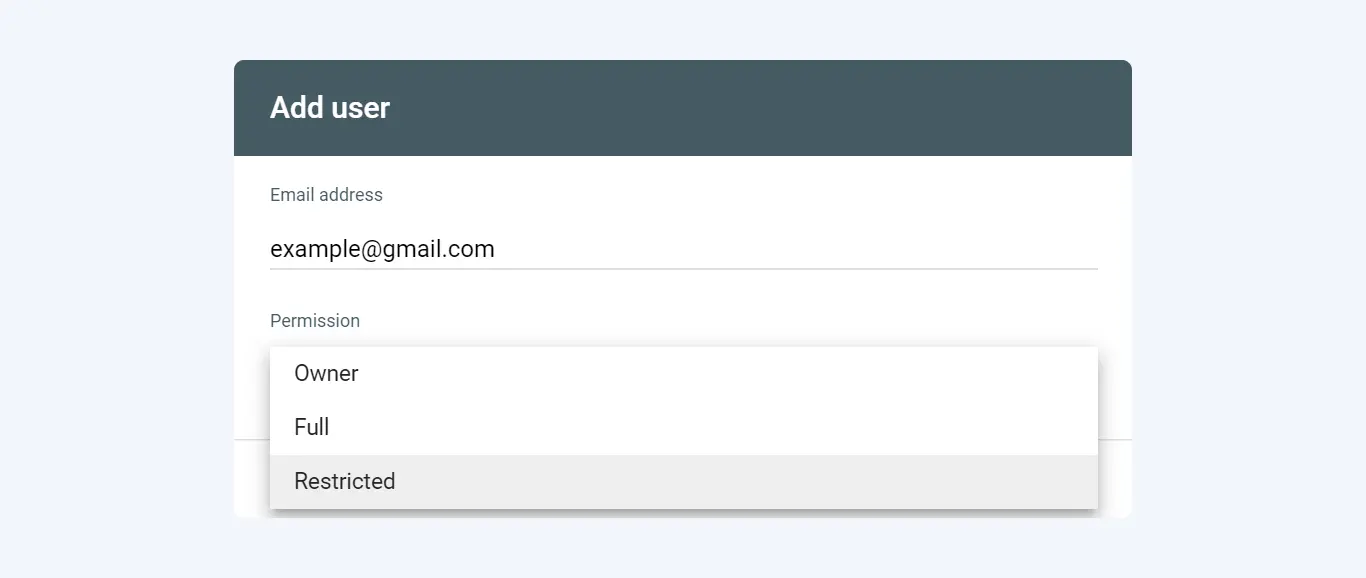
After filling out the form you can click the “Add” button to add a user or press “Cancel” to cancel. Successfully added users have access to monitor website performance in Google Search Console according to the permissions given.
All in all, that's an in-depth guideline of Google Search Console, starting from the definition, description of each feature, and how to use it. You can use this tool to add a sitemap, monitor site performance, and detect crawling and indexing issues. Make sure to always check the site regularly through the GSC.
WDYT, you like my article?